Off the Top: Information Design Entries

20052010201520202025

Showing posts: 1-15 of 143 total posts


22 September 2026

Modernized Page Structure for the Model of Attraction Draft from March 2002

I’ve been looking at filling in the gaps around the Personal InfoCloud and setting the foundation for it in the four InfoClouds in an Overview of the InfoClouds, but pointing back to a quick framing of the Model of Attraction, mostly leans to the original draft (and only a first draft) of the Model of Attraction - First Draft :: vanderwal.net that I wrote on a flight back home from Austin when the idea hit.

Looking at that page, the page was still in a 2002 or 2003 layout and design, which is quite similar to what it is today, but the text was much smaller and the page much narrower.

Update of the Layout Structure

I updated the layout structure of the page and the HTML framework of the page and used the current CSS that does much of the layout work (then and now). I also fixed a few typos and corrected the date at the top, which was a year off as stated elsewhere, as March 2002 is the correct date.

I Haven’t Read Through This In a Long While

As I was resetting the scaffolding of the page I realized it has been a long time since I have read this in full, and I need to set aside time to do that. There are quite a few things I wrote out fully in the rough draft and in the outlined sections at the end, which set the foundations for much that was to follow. But, it goes much farther in a broad sense pulling things in and building bridges to uses of the model within different domains that people work in. The initial piece also calls out the initial rough use of info cloud in my quote:

“Users have a rough cloud of information following them that has a magnetic attraction toward them and their interests.”

I had forgotten about that. It had been captured by someone I was talking with as the idea was gelling and I used it a couple of times and realized it had gravity. This became the hook for InfoCloud.


20 September 2026

An Insanely Good Bookshelf Viewer

I have a thing for books, bookshelves, bookstores, and libraries. Doing a quick scroll through Mastodon and I saw Marcin Wichary posted something that stopped me cold, in a good way. This bookshelf viewer in his post, My design bookshelves – Aresluna, is amazing.

I have many of the same books and enjoy them, I have the same horizontal stacks in front of vertically placed book, and I did the “ooh, I’ve been wanting to go through this one” and the “if this book is there these other surely are as well”.

But, the most wonderful thing is the design and interaction of the viewer, with the ability to click to see more about a book and go to where you may pick up a copy. I really like the rotation of the inspection lens and being able to see the books behind horizontally shelved books in front of the vertically shelved books. This is so insanely well done.

For a few months I’ve been taking pictures of my shelves, quickly having them converted to markdown lists for the shelf with title and author backlinks, mapped my bookcases and stacks. But, I keep culling my shelves and moving things, which means redoing the pictures and conversion of shelves’ lists. Having something a little more interactive like this may help calm the moving of books, but I do have many I don’t care about, are drastically out of date (unless I time travel), or picked up and just weren’t good.

Seeing Marcin’s interactive interface makes me want to go in that direction. But, for my immediate needs I really need to finish capturing my shelves, converting, and tying the list to the mapping. Someday I can tackle something like what Marcin has done, but maybe someday that will be made well and available to use on my books and collection.


16 September 2026

I Wrote What?

Part of the impetus for writing this post has been driven by the updates at A new Observable | Observable, which I recently wrote about Large Observable Update :: Off the Top :: vanderwal.net, and looking at changes in not only Observable, but updates to D3 by Observable. These current and not-too-distant updates have had me thinking about what I could do with some of my blogging data to make interactive charts and graphs. I’ve recently moved a lot of my legacy static charts and graphs to Plotly to gain interaction with them, for many of my own uses. But, in the process of getting a decent data workflow setup for my site (and my notes data) I have relatively clean data locally ready for use and testing.

A Little Data Workflow Background

For this blog I have been pulling down the data from the site’s backend and converting it with a set python script to extract it to SQLite, which is relational but quite fast for reading data and is great for single user write and a few read options. Over the past few months I’ve also been building many data analytics and data visualization prep python scripts (some building JSON files for standalone webpage interfaces). I’ve used Claude to debug, but also just turn out a script in less than couple minutes for the page setup for the D3 or Plotly scripts, which would usually take me 30 to 120 minutes. Once the scripts are set and I’ve reviewed them it is all just setting python flags and minor tweaks to the script to handle a data update.

With these script setups I’ve been able to try quite a few D3 chart and graph options very quickly. Going through the Python code, the data structures for the visualizations, and the hooks for the visualization and I’m rather happy with it for quick outputs.

What Can I See Using Blaugust Data

One of the things I had interest in from my A Wrap to Blaugust / Blaugust run in August was what did all of that look like from a basic statistic and graphical perspective. A few months back I created and ran a bunch of Jupyter queries and visualizations, Personal Blog Data Analysis - Looking at 25 Years. Since then I’ve been thinking about looking at a monthly view with more interactive charts and graphs. Since I had a decent amount of data from August 2026, existing data workflows, and a few D3 charting and graphing options I could work with I took a look.

August Off the Top Force Graph

The first is an interactive forced graph with the blogpost as orange nodes with the size corresponding to word count and the tethered edges link to categories for the post. Clicking on the post will show the related categories and pulling on the post node will start to see the other tethered posts connected through the categories. There are few toggles: 1) Posts and categories or just Posts with their related interconnections; 2) Only show shared categories (a category with more than one post); 3) Post to Time, which may be my favorite view, as it take the graph and lays out the posts left (oldest) to right (most recent), with a small light timeline at the bottom and all the other relationships displayed as well; 4) Post titles, which clutters things a bit and adding the toggle resolved that clutter.

You can view this standalone interactive web chart that sits in the Lab :: Off the Top Analytics at the direct link: Off the Top, August Force Graph with Toggles. A sample is here:
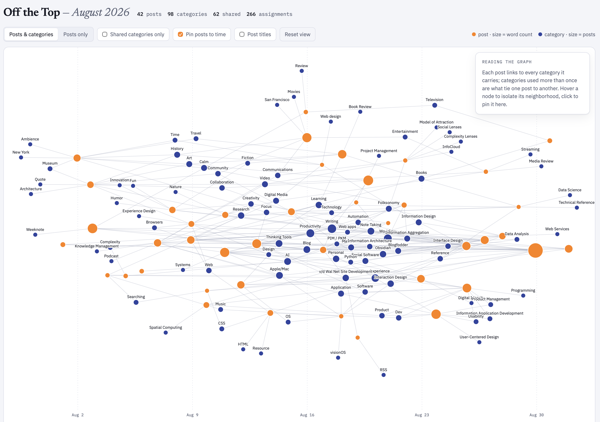
A forged graph chart image showing August 2026 posts and connected categories

August 2026 Word Counts

As I was going through the data for August 2026 I knew and could see the word counts for posts, which I don’t have easily (nor quickly) available on my site. But, with the data local in SQLite and I’ve been using the local data to run many types of post analytics, word counts become a simple and quick option that doesn’t impact the site’s performance at all.

I was really curious about word counts per post across August, but also was more curious about a cumulative word count across the month as well. A quick and easy bar chart and line graph solved this, both having interactive hovers for metadata. August had 25,390 words posted.

The standalone interactive web chart is also in the Lab and the direct link is: Off the Top, August Word Counts by Post and Cumulative Count. A sample is here:
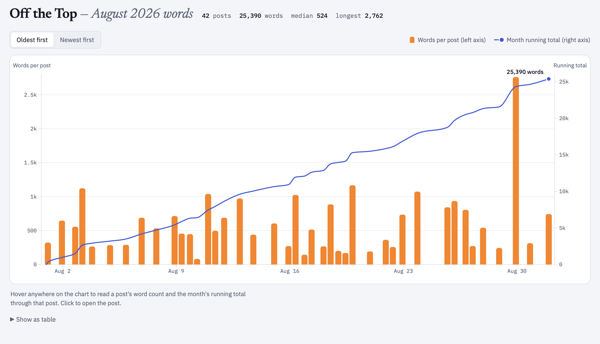
A bar chart image of monthly posts with height correlating to word count and a line above the bar chart showing cumulative word count for the month August 2026 posts

Cumulative Word Count for 2001 to 2026

Looking at the cumulative count for August 2026 (the 25,390 words posted in the month) I had no idea what that count was in comparison to the whole life span of the blog (under this CMS that started in late October 2001 and not including the static posts prior to that). I know that in the early months and years of the blog I wrote a lot of short posts and the posts were frequent. Looking at word count I wasn’t expecting the first two or three years to have roughly the same growth slope up to 2008.

Looking across 25 years of posts I knew a single post analysis was going to be a bit rough for an interactive standalone webpage. Monthly would be better, but could still be a bit too much to process dynamically in the browser. Quarterly, was just a bit on the thin side and more difficult to see trend shifts and correlative line slope. I settled on a two-month interval and I had something interesting in under a minute.

July and August 2026 were the highest word count across all time on this blog. The 25 thousand words is roughly a quarter of a 250 page book. But, now that I had the bi-monthly chart I can also see the early years I had roughly similar counts per two months up until 2008 and then there was the “great flattening”, until the “great pandemica” lockdown when things ticked up again until lockdown ease and work went back to its normal patterns.

I ended up over the 25 years with 437,417 cumulative words just on this blog. That is roughly 4 books of 250 pages. It would be a rather odd book, but in just considering word count as the focus. I find word counts odd, particularly writing to word counts. I’ve had a regular column in tech publication that had a 750 rough word count topic, this was at a time when my posts were often 1,000 to 1,250 words on average and 750 words was about where I had the framing set to get to the meat of things. I mostly write on this blog to an amount where there aren’t good words left, which is 200 at times to 2,500 or more. To see my writing shifts in the early years roughly similar in trajectory rather interesting.

The standalone interactive web chart is also in the Lab and its direct link is: Off the Top All-time Cumulative Word Count. A sample is here:
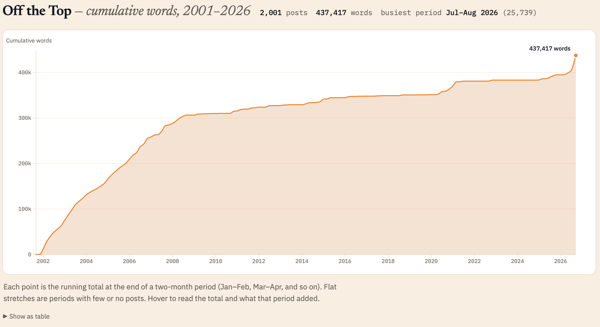
A line chart showing cumulative word counts across 25 years of blog posts

Will this Continue?

Now that these are standalone webpage charts and graphs, I’m not sure what I will do. I need to get the templates consistent from a layout and design perspective. But, once the standalone webpage is created I just copy it to the Lab or other location, and this can be automated with a quick script. I think the month-by-month analytic is interesting, at least to me. I have not only the local standalone version that I posted, but a rough output build that isn’t fully self-contained that I can play with and iterate on.

If you like this and want to see more ping me on one of the services or send an e-mail using the Contact in the navbar.


15 September 2026

Two New Categories that May Have not been Noticed

In yesterday’s post (A Rainy Virtual Walk Sparks Reading) I had a couple friends reach out today and comment that there was a new category, Calm :: Category :: vanderwal.net, that appeared. This is correct, I added “Calm” as a new category (today I went back and added it to past posts were it applied as well, a few more may be added as I discover the need).

But, I also made another addition in categories and used it on yesterday’s post as well, Ambience :: Category :: vanderwal.net.

The Two New Categories Have Long Been Central as Perspectives

The idea and ideal of calm has been something central that I realized I seek and have noticed for more than a couple of decades (and in reality, much longer). In 2000 I had a moment where this really struck me as I was leading a skunkworks / innovation project, but also writing code and coordinating the design to code, data interactions, and interoperability to other services. There was a lot going on and it needed focus. I hadn’t noticed that my desk phone had been quite for months. The assistant to the Executive Director came into our office to find me and apologize that somehow my phone number had been routed to the bureau’s fax number. I no longer had a working phone at my desk and hadn’t had one for months.

The apology came with a promise to get a phone working for me again. I realized the focus and lack of extra disruption this provided me with a calm environment to get things done. I asked for a promise to not turn the phone back on. My preferred method of communication was instant message, which I would read and reply to when I cleared my head of what I was concentrating on or email as an alternative. The phone ringing meant I should drop what I’m doing and respond.

But, I had long been aware of the need for calm environments. I like the loud, chaotic, and erratic, but in limited doses that have a known end. I learned early that severe silence also is a trigger alert for the brain for trouble. There needs to be a little something, but often something minimal so one can focus where they need to focus.

Calm and Atmospheric Ambience as a Criteria

I’ve long had a preference for calm interfaces and interaction models in design. I tend to push things out that scream for attention. But, with user testing I’ve found most people get distracted for heavy motion interfaces that are there to wow, but the motion isn’t the focus, it is the content that goes with it, which utterly fails at designing for use. This is often from people who don’t understand good design, nor what a product should actually do as the product’s purpose.These are basics, not good to haves.

For years I’ve had my devices with the sound off, or a light ambient sound that is just noticeable in the background. I may have something in the background playing as music or atmospherics (like the background sound of a damp Paris walk for a few hours or a calm cafe). That ambience is akin to calm, but also provides something that is in the background and not screaming for attention. It is an atmospheric layer that can mute or numb the jarring cacophony.

When I’m writing to capture things as notes or writing to understand things a little light ambient sound helps. But, when getting to the honing of that output I need the focus on that task at hand. One of my workflow passes for things I write often goes through iA Writer app, which I bring up a fair amount, a it is focussed on your words you are writing. It is an interface with a calm interface, but can fade to your words you are writing and little more, or further fade further to the line you are writing in context of a few lines around it. The calmness and ambient focus pull everything else away.

There is a kindred relationship between calmness and ambience / ambient environments that pull one into focus and regard the task at hand with the care and attention it needs.

Calm and Ambience are Attributes Worth Noting

In my notes on environment, gatherings, but also apps and services the term “calm” shows up a lot. These are often things I deeply enjoy and appreciate. I equate ambience with atmospheric essence and ambient qualities that don’t overwhelm, but are just noticeably there to augment, but not take the focus.

As I think about adding definitions to the category pages, these two terms, calm and ambience, are ones that are a little squishy. I also realize but I’m realizing I need to call out more as the are often central to getting things with the focus in the right places.


12 September 2026

Large Observable Update

Around mid-week Observable announced a major update on their blog (A new Observable) and my evenings turned into looking at updates to the Notebooks, charts / data visualization offerings and much more. There are more interactive charting models and this is the first time I’ve noticed a downloadable notebook app for Macs (I haven’t tried it yet).

I use D3 by Observable quite a bit for data visualizations form data focussed apps (I also have been using Plotly for local Python interactive data apps). I started using D3 in late 2011 for some small data visualization projects, but in 2012 was working on a large project that made extensive use of it and it has stuck as a tool in my tool belt.

I often use Pandas, Polars, and Jupyter, but also RStudio. It might be time to look at Observable’s notebook, but I’m not overly fond of JavaScript and I’ve been using Claude to assist cut down the struggles with JS and getting to looking at and interacting with data visualizations.

The D3 and Observable sites have been some of the best resources for understanding data visualization basics and good fits for data and visualizations. The education aspect, as well as the really good quality charts and visualization tools have made it a regular resource that I use and regularly point others to.

I still have a lot of Observable and D3js tabs open as I’m pulling better notes for myself. But, I figured it was a good time to share it with others.


Tony Seale’s Knowledge Graph and Complexity Posts

This week I fell into two (mostly) enjoyable rabbit holes. One was digging into the writings of Tony Seale (one of The Knowledge Graph Guys) after a few friends had shared his posts in LinkedIn. The hedging of the enjoyability stems from the utter poor environment LinkedIn is for finding, holding on to, sharing outside the confines, and working with wonderful ideas in one’s own space and properly giving attribution. Only posting information in LinkedIn is like going to a huge supermarket, but cooking, and serving your creation there. LinkedIn is poorly built for this intention. If you care about the ideas you are creating and sharing, put them where you control them and others who are inspired and want to find and interact more with your ideas and you can do so far more easily.

That aside, I did enough battle LinkedIn’s incredibly poor interaction design and information design for idea sharing to find an abundance of good ideas shared by Tony Seale. So many framings are at a good level of a little more than simple but crafted well to have concepts that are difficult for others to grasp easily put closer to within their reach. I am always looking for explainers like these to share and for inspiration. But, even better when the ideas and framings are really solid, like Seale’s.

I dug back into the blog of The Knowledge Graph Guys, which is good, but is lacking a name and the posts don’t have the consistency of the same voice, which is to be expected. But, give names to the different voices.

I found some of Seale’s posts on his Tony Seale – Medium space. These Medium posts focus more on complexity, which I enjoyed as well.

I pulled some notes and graphics from Tony Seale’s LinkedIn posts, but I’m still pulling all of that together (see frustration with LinkedIn). I really like the linking to prior content and outside material in his posts as well as those in The Knowledge Graph Guys (which isn’t all guys). Many of the posts I agree with as stand-alone pieces, but I need to pull them together in context to see those connections. (It is also ironic that Knowledge Graph focussed content uses LinkedIn as the only instance where getting and retaining connections, as in a graph, is quite difficult.) That said it is likely worth your time digging.


5 September 2026

A Quick Category Page Lab Update

Today I thought I may be able to tackle 2 of the 6 tasks for features and functionality I want to take care of before moving the Category page in the Lab to the production side. Well, one of the tasks (the definitions) I knew is going to be pushed out as it going to take sit down and type words time. The other sort of large task was going to break some ease of use functionality and breaking something I find helpful is a bit of a problem, but also adds odd friction.

What Got Done

I was able to knock out four of the tasks that get the Category page in a much better place than it is at the moment.

The sidebar with the “Year Range” and “Co-category” selection was cleaned up and now with fixing the line wrapping for the long category names, so they no longer go under the radio button when the line wraps.

The inconsistency of the design of the counts for the two areas of selection is fixed and now the count has a subtle light box around them so the counts are noticeable but not drawing too much attention. Working with shades of orange is always tedious, but I like orange enough to deal with it.

There is now a noticeably clear filter selections button for the sidebar and in the main content section at the top. The button at the bottom of the sidebar to submit the filter selections matches the clear the filters buttons. The sidebar radio buttons (if you have JavaScript on) don’t require the submit button, but it is there for those with JavaScript turned off. This wraps up the sidebar.

The unfiltered category page now starts with a distribution chart that is larger than the sparklines on the category listing pages and it has small demarcations every 5 years. This is generated with SVG, like the sparklines.

When you make filter selections the distribution chart goes away (until the selections are cleared) and the filters selected are now laid out properly. This section also has a clear filter selection button as well.

You can try it from the link in the category filtering test section of the Lab notes about this.

This May be Close to Pushing Live

I am going to sleep on it and possibly push it live tomorrow on on the holiday Monday.


4 September 2026

Category Page Filtering Testing

Little by little I’ve been tackling some of the functional needs for this site. As I went through the initial look at the analytics for my blog and site related to content (see Personal Blog Data Analysis - Looking at 25 Years) I see needs from a use perspective from visitor / reader perspectives.

I have many categories (210 as of today) and most posts have at least two categories on them. Categories are a means for a reader to click on them and find more posts that are similar, or contain similar content. Some of the categories have more than 100 posts and there needs to be a means to filter those down somewhat sanely. The two options I’ve leaned into are time ranges and co-categories. I have started framing out the both of these filters in the vanderwal.net Lab and the Lab’s Category Tests :: Lab :: vanderwal.net (go to the Category Testing Page Filtering) to get to the testing of the iterations.

Filtering Options

With 25 years of blog posts and coming up on 2,200 posts breaking down the years as one filtering option is to filter by year ranges. There is a heavy volume and velocity of posts in the first 7 years and then it slowed down. Trying to get consistent year ranges and having most year ranges have posts, which still narrows the number of posts, was one of the main goals. The happy spot seemed to be around a range of 5 years with the aim of the start of the year range being the “0” and “5” year as the start of the range (this theme will resurface more with other restructurings).

The co-categories from a surfacing and selecting perspective is decent, but some categories have long lists of co-categories. Currently selecting a radio button triggers the change if the user’s browser has JavaScript on, but the filter button to select the filter at the bottom of the list works even if JavaScript is off.

I still have tweaks I want to iterate through and those will continue in the Lab. The listing of the active filters is something I need to improve as well as adding a button to clear the filters.

More Modifications for the Page

One thing that will be coming in the near future is the unfiltered category page will have a distribution chart at the top of the page, like a larger sparkline with labelling (hopefully) for years or year ranges. Once this is added and the filtering is in a good spot, the modifications will move to production from the Lab.

Farther down the line a category definition will be added to the page at some point. The database has been set for a while to handle this. The backend management needs to get built and the category pages need to get enabled for to surface the definitions. Then the definitions need to get written as the definitions are not dictionary definitions, but definitions of “the what”, but also how they are applied.


2 September 2026

Can I See What You Are Writing

The medium for thinking and consumption is something I continually consider. I don’t consume audiobooks, they don’t work for me and I have too many foundational problems with them. But, I do enjoy podcasts, but that is a naturally spoken medium. For consumption of fiction and most non-fiction I have a strong preference for print (physical and/or electronic). Non-fiction text gives the opportunity for illustrations that help augment and anchor the meaning. Video can work for many concepts if they are done well and illustrate concepts.

Reading fiction my mind slips into vivid depictions of the story and scenes (if the book captures me). Being able to see characters in my head helps keep the storyline sorted. I really appreciate authors that are crafty with languages that trigger the visualizations as I am reading. With reading fiction my mind may also drift (if the book is good, but this also happens with non-fiction as I am framing where this new information sifts in with other things known). When my mind drifts I may still be “reading” and flipping pages, but when I snap out of it I can flip back to where my mind drifted and continue on again (as a couple of my college professor encourage this is a really good and engaging way to read). Most often the drifting is related to something in the book triggering ideas and it gets my mind going. Audio books have my mind drift out from a of lack of interest, but more problematic is there really isn’t a good way to go back and pick-up where my mind drifted (oddly podcasts my mind will drift from them triggering ideas and also from a conversation the podcast triggers, particularly when they run adjacent to things I know well or they mis-state something).

The visualization in my mind is really helpful to keep engaged and it is great for recall as well. But, when a book turns into a film or tv show it sometimes helps (when there are many characters) to anchor the “whos”. The reading of plays I find difficult, unless I have seen the play or have photos or sketches of who is playing the role and then I fully connect. But, if it a book with illustrated characters, like the Moomins (I read a lot of Moomin books when I was a kid) and that turns into tv or a movie it breaks things my mental image of the illustrations through the stories are not in alignment. The Moomins were quite off (at least in the US series). But, Paddington worked just fine. With the Moomins becoming semi-popular in the US with young adults, I’ll ask about a person’s favorite Moomin or story and I find we are talking about Moomins from different universes it seems.

Seeing is Understanding

The mental images and visualizing ideas and concepts also drive explainers in presentations and the use of animation in presentations. That same principle for my engaging also goes outward when explaining things for others. Creating images and animations, for complicated or complex ideas, models, or patterns allows for pulling them apart, seeing things interact, and also provides the ability to point and talk about something specific and makes things less abstract.

I’m thinking about text and visualizations as I’m working on creating small videos of some of the core concepts and ideas around folksonomy, Model of Attraction, InfoClouds, etc. Listening to words is a thin and ephemeral representation of the ideas. Seeing the words is a bit better. But words and seeing relationships are key to communicating far better. I’m mindful not all minds are alike nor process the same way, so having many paths for engaging works quite well.


27 August 2026

Zeef Returning

One of the things that has been bringing enjoyment lately is seeing ZEEF coming back to life. It self-describes as: “Curated links, found by algorithms, sifted by people”. I’ve used the new version and have found it more responsive and a bit easier to use.

I have set up a curator page in the new Zeef at Thomas Vander Wal | ZEEF. If you are new to Zeef and didn’t catch it the first time around, it is a different perspective on saved and shared links. Where things like Delicious and Pinboard focus on an abundance of links which the users tags as they go, which provides a folksonomy / folksonomy - defined of terms from the bookmarker’s output, Zeef has a focus on categories on a curator’s page and the links the curator believes are appropriate for that term. From a folksonomy perspective the person adding the tag / category is very clear (which is essential), the group of links has the category, and the links are the objects being tagged / categorized. Different people have different perspectives as we each have multiple contexts from our lives and everybody has a unique set of those contexts.

This early resurfacing of Zeef is still a work in progress, but has some nice new additions. One of the pieces I like is, curators having the option of adding a “why” to the links for a term. This “why” I find valuable as knowing why a curator added a link to their collection provides increased value for those reading the collections. On my page I have started a category collection for folksonomy and I’ve captured an initial three links in the section and I’m showing an expanded the entry for the Ontology of Folksonomy (from Tom Gruber) that shows the “Curator’s Note” and the “Why” reasoning I added. The Curator’s Note provides a definition opportunity and there the link fits, whereas the “Why” is the curator’s insight as to why they believe it is worth including.

Prior Zeef Mentions

The first version of Zeef was something I enjoyed, but didn’t take full advantage of, but I had ideas of how to expand my curated sets. I was looking at it for how to handle Blogfodder and Linkfodder. I also was thinking it could help with managing What to do with Podcast Favorites.

Looking Forward to Zeef As It Move Forward

This new version of Zeef is something I am looking forward to seeing grow and get used again. I think there is a place for having solid curation of links and resources. I’ve been thinking about how Zeef could be the community space to find resources centrally, like things captured on people’s personal sites in their slash pages (slash pages) which they keep on their site, but have a place to discover centrally.

I also really like the idea of having researchers and professionals curate their list of categorized resources. One thing I really enjoy this time of year are syllabi for courses and to see reading lists for new sources, but also how professors frame the accretion of understanding build over a semester (for those professors that share these openly).


25 August 2026

Adjusting Daily Aggregation for Less Friction

Sunday I hit a point where my daily automations (which I layout in part here - My Automations Over the Ages and Today’s View in my morning process and weekly process) and placing the outputs into my Daily Dump note sections was really making for a lot of friction in my note taking / note making. Additionally, it was breaking focus and holding my concentration on what I was trying to capture in my note’s sections.

How Daily Dump Notes are Setup

My Daily Dump has 14 sections: Plans, Thoughts, Review, Read, Talked With, Listened, Watched, Productivity, Worked, Learned, Played, Ate, Health, Bought, and Added to a wishlist.

The intent with the subheads in my note is to quickly jump to the section as I run across something or am thinking through and idea or concept and capture the thoughts or what I consumed and ideas from it, so I can get back to it later in my notes. But, since this is markdown and in Obsidian I can take the notes with its subheading and text, extract it, and then transclude it (move it out and link it back in to show it in another note). But, having each day’s note relatively clean (the exception is the Plans section for things brewing and on the front burner to do are moved from the prior day’s note to the current day’s with a python script that keeps the completed tasks on the prior day and removes things not completed and moved them to today).

Friction from Adding Aggregation to the Sections

The daily aggregations pulled in things captured from various reading and copying or favoriting tasks that get automatically captured in Instapaper and Pinboard, as well as all the files I created and modified. I also have notes from Drafts that I capture on the go and tagged to get pulled in aggregated, as well as a list of things I watched online that I want to track, but also list of videos watched where I’ve captured the transcript in Readwise I may want to review (and likely do a further clean-up step).

All of this was getting aggregated into collective notes by type and transcluded into the relevant groups in my Daily Dump note. This added a lot of friction to the intent of my Daily Dump for quick easy drop into a section and capture a note and then after sort out how I may handle it. Add to this, Sunday my Weekly Review runs and captures all of this from the week and compiles it into one note so with a heat map at the top so I can review it to see what I’ve been doing and find things to cut back on or put focus on for the upcoming week. The Weekly Review was transcluded into Productivity, which is ironic as all of this adding of aggregation transclusions was making me really unproductive.

The Fix to Bring Back Focus and Quick Capture

On Sunday I had enough of the friction and took time to sort out a solution. I liked the capture and the ability to scan through and find things I need to continue working on or make a change on, but having it in my quick capture notes area made it tough.

I added a “Review” section just under Plans and now all aggregations and transclusions go there. The best part is when I’m not reviewing it, a heading in Obsidian can be collapsed, which gives me focus on everything else.

On Sunday I did a quick manual restructuring of my note by putting everything aggregated into the Review section and then collapsed it. This was a magical focus trick.

Updating the Python Script that Automates Transclusion

Sunday I did the first edit of the python script that takes the aggregations notes created earlier in the moring and transcludes them in and repointed them to not go into the other categories, but all go into Review. This hasn’t run perfectly yesterday nor today (it works when I trigger it to run manually, but not from the trigger to run the script), but it is getting closer.

Protecting Focus is Key

Protecting focus and being able to quickly shift focus and be productive is key and has been something I’ve been working to do since I was a kid. Over the years I’ve learned the distractions and how to pull focus and calm back in. Removing the friction from abundance of information already in where I needed clean space to quickly capture created the large problem.

Now my big next step is sorting out the time to actually get a good weekly review done from what I’ve aggregated. The capture has been really good, but I just need to get better about protecting time on Sunday (or move this to Saturday) so I can sit and focus on what was done, what I can reduce and what needs focus to get done.


16 August 2026

Halfway Through Blaugust

At the halfway point of Blaugust following my saying I was in on Blaugust and aiming for 31 post in August, it is time for a check-in. On the 16th of August I have 22 posts (counting this post), which is more than I expected. I had two personal goals for the Blaugust endeavor: 1) Get back in the habit of posting and comfortable with the workflow; 2) Make a dent on my long list of blogfodder.

Back Comfortable with My Workflow

Not only am I comfortable with my workflow, but I’ve made tweaks to it. I have a lot of Daily Dump notes with things written out in the sections that could easily turn into a blog post. Now I have a smoother flow taking those notes and quickly extracting them to their own note, immediately having it transcluded back in, add the blog note framings, as well as blogfodder tracking, which makes it very quick to extract, wrap it for a post, and run through the edit and posting steps.

I am not only more comfortable with my process, but I’m feeling like I’m back living in my site again. I am using my blog search as I prep a note to potentially post to see what I have that may be similar or nice to add to a post as a reference. I also have been finding quite a few small UI gaffs that needed fixing and knocking them out. All pages in the blog area should have “Blog Search” in the navigation. There were layout twitches in layout switching between blog main page and individual post pages, which has been there a long time. This twitch isn’t fully gone, but far less noticeable.

Another thing I did was add some categories to accommodate creative and fiction posts, which I have been trying to sort out what to do with them. I may have another option at some point, but for now I have a decent option.

Making a Dent In Blogfodder List?

Uh… On this front I have knocked out a few items on the blogfodder list, cleaned up the list a little, but the list got a bit longer. Many of the posts for Blaugust have been new ideas and not coming out of the blogfodder list. Many of the items on the list are longer pieces and need more work, but they are likely going to be posted on Personal InfoCloud, but I will note here that I’ve posted there (just like the old days).

Some of those longer pieces will cover: “folksonomy and LLMs” (this question comes up a lot and helping quite a few understand the realities and frame their needs); “My working with AI since 2008”; “My AI policy for my sites (in short nothing read was created or edited by AI)”; “AI and Social Computing (particularly around teams and organizations)”; and other topic. I have quite a few others I swore I have posted over the years, but nope, so I’ve queued those up as well.


The Insider and a Focussed Look

One of the weekly wrap-ups I enjoy, which is also sort of a weeknote, is from David Pierce on The Verge in his Installer Newsletter. I always find things I hadn’t seen and when he digs into note taking and productivity I really pay attention.

This week’s The End of Oak Street is the surprise must-see movie of the summer | The Verge (I don’t know if this takes a subscription or not) was quite good (and David’s last before his paternity leave).

What Stood Out

But, there was on gem that really stood out in the list, Ordinary Abundance, which is really enjoyable. It is a great focussed look at an apartment with focus shifting as you scroll and the item in focus put into context.

I really like pieces like this and would enjoy more.


22 June 2026

Does the Internet Make My Type Look Small

Early in the week I was “doing a thing” that is part of future improvement to the back catalog of 25 plus years of posts and I looking at my site a lot, as well as other sites and my type looked small when comparing to most. To me my site was quite readable and keeping comfortable line lengths, but there was a size difference that I really hadn’t noticed as much.

I checked with a few fellow bloggers, whom I swore recently had type around the same rendered size mine has, but they nearly all said they hadn’t touched their type size in years (a couple had adjusted it in recent months). Their type sizes were larger.

Adjusting Type Size

The last visual adjustments I made were in 2020 and it was a bumping up of the default type size and making the page size wider, as screens were larger and could accommodate the size increase of the type (today I found my original draft of the Model of Attraction is still in the older page size - Model of Attraction - First Draft).

I still set the default font size in pixels and call Helvetica Neue to be displayed. I started working with the modifying the CSS in the Lab - vanderwal.net, as there are enough page types in there to test many of the layouts and furniture with the adjustments.

I bumped up the font size two pixels and that needed a lot of adjustments for the header, nav bar, margins, and padding. I was about halfway through the adjustments of sizing for other CSS elements when I realized the line lengths for body text were tight, like a cheap suit that “stretches”. I backed down the font size one pixel and that improved the type size nicely and kept good line lengths and reading more comfortable. One thing I needed to do was add height to the heading to let the “highly creative” heading set more clearly again. This meant adjusting the height of the heading background image (there is plenty of width).

I completed adjusting the margins and padding and the body text was breathing well. I opened a few other pages from other sites I regularly visit for blogs and new and informative sites. The type on vanderwal.net felt like it fit on the web.

Moving the CSS Out of the Lab

On Friday I took the steps to move the CSS over to this side of things.Because there are some things that are a little different on the Lab side I needed to use diff to compare the two CSS files and update this side. I turned to my trusty BBEdit to do the task (I hadn’t used the compare in BBEdit in years) and it reminded me why I like using BBEdit for the, “I wish I had something that could…” type tasks.

After about a half an hour things were sorted and most things looked as I had hoped. There are a handful of alignments that need fussing with. There is a margin and / or padding issue that has been around from the last size tweaking a few years back.

Side Benefit

There are some small benefits that have come from these adjustments. One is related to the links page and improved ease clicking Vision Pro and on iPad. I have kept the line height a bit tight as there are many links and on a laptop or desktop screen it is fine clicking. It has also improved clicking on mobile as the touch target is increase.


30 May 2026

Updated Categories with Sparklines and Search is Now in Production

I made a couple of updates I have long wanted to make to this site. I’ve been wanting to see frequency of categories used on my blog for more than 15 years (or pretty much since I’ve had category list pages). I have also wanted to have blog search and the utter mess that Google Search has become in recent years, where my site isn’t showing at all at times has driven this. These additions will likely iterate and adapt a bit going forward.

Updates to Category Lists with Sparklines

I have basically had two category list pages for years: Category List (which is alphabetical sort) and Category List by Use. I have kept these two and added sparklines to them (Sparkline - Wikipedia). Each line now has a small line chart that covers the 25+ years and what periods had used the category and some sense of the volume of use over time. One category list view I wanted and was missing was one to show a view with the focus of most recently used categories, so there is now a Category Recently Used List that not only groups by most recently used (and in the same entry keeps the alphabetical sort) but also shows the date of the last use in the list. Personally, I have been finding this recently used list view the most helpful and interesting. Skimming through the list I know I have more recent posts that have covered or touched on a subject, but it didn’t include the category, and that becomes a quick task to fix that gap.

Sparklines?

I have been a big fan of sparklines to give quick understanding of data’s distributions at a glance, which I learned about in “recommended reading” of Edward Tufte’s book The Visual Display of Quantitative Information | Edward Tufte in grad school in social / policy quant classes. (There are are many Tufte essays and book annotations on sparklines at Edward Tufte Notebooks & Sketches | Art, Science and Sculpture).

Creating the Sparklines

In creating the sparklines for my category lists I looked initially (and have long looked at them) creating static images from the data and bringing the images in (this would mean updating the images and replacing the old with the new ones, which is relatively straight forward programmatically and something I’ve done in the past, but not optimal) and I also looked at JavaScript but it was a bit slow. I poked at using creating SVGs (which work well when printing or zooming in) and often are much quicker and less strain on a browser than JavaScript. I’ve had a few goes at SVG in the past and I get get my mind around simple shapes, but I would need a little help with sparklines. A couple years back on a sparkline spelunking I found Easy SVG sparklines | Alex Plescan which showed the how. But, I have SVGs somewhat in the same category as regex, which is I do it rarely and I’ll just use Claude Code | Anthropic’s agentic coding system \ Anthropic to assist with the creation.

Chunking the Data for a Sparkline

The other part of sparklines is they are intended to be small glimpses and I have 25+ years of posts and a monthly temporal segmentation would make for a long graphic. I played around with breaking things down to quarters, but in the end I went with two segments per year and roughly 50 data points to map out on a line chart. Running a test with the two data points a year was a reasonable enough glimpse to sort out if the category was used recently or what the variation of use was over time.

One of the interesting discoveries with the first lab run of the categories of sparklines was the rather “U shaped” distribution of the use of categories, which pretty much calls out the lull I had in blogging. This softening of blog post rhythm is something I call, “when Twitter ate my blog” (where the interesting things I would discover and want to share and interact around ended up on Twitter rather than my blog(s)). Other patterns that surfaced were limited use a category in a period when I was rather sure I had posted on the subject, some of this was I was not using the term in that way or I didn’t have the category in my system yet. One of the things that helped sort this out was using my blog search.

Search is Now Out of the Lab

One of the things I have been working on and using my my Lab at vanderwal.net is blog search. But, the modifications I made to the Category pages I found I was leaning on my blog search a fair amount to investigate things. But, the categories and blog search are both in the blog section of this site, so making the change from the lab to the production side made sense. One of the things holding back moving search over, was I had an SVG of a magnifying class in the menu bar with “Blog Search”, but no matter how small I made the image it still was messing with the vertical layout of the menubar. In removing the magnifying glass and just using text things kept to the same layout.

Bringing in Search

The search in the menu in the pages in the blog section with “Off the Top” or “random” in the URL which is where there are currently menubar links to Blog Search. I have the menu bar link to a search page to search from rather than a JavaScript drop down or other menu bar convention (again layout of the menu bar was part of the considerations).

When I was working on search in the Lab section I found I needed to make some modifications to the database to have quicker search and I needed to modify the database engine so I could have search include 3 letter terms as a minimum rather than 4 letter words. In working on search I found many of my early posts didn’t (and still don’t) have titles and I was using the title as the link. I initially thought I would just add titles, but there are around 300 posts that don’t have titles (I’m adding some as I touch the posts for other clean-up issues), but I ended up coding the search results to have the results just fill in “Blog Post #…” as a proxy for a proper title.

The initial 170 or so posts are not in the database and are therefore not in the search.

Bringing Search and Categories In

As I went to move the category list pages out of the lab and into the production side I needed to modify a few other templates and pages to add the updated links. In doing this I realized I could also easily update the menu bar to include “Blog Search”. So, I took a little bit of time and made both changes at the same time.

Not all of the links are in yet. If you see something a little off with category lists or missing blog search links let me know.


This work is licensed under the Creative Commons Attribution-NonCommercial-ShareAlike License.